
The U.S. stock market, as measured by the S&P 500 Index SPX, stumbled into the end of January. On the positive side, since January registered a gain, that is a longer-term positive under the “January Barometer” philosophy (as goes January, so goes the year). On the other hand, this market is in need of a rest, and February has been a down month in many years — sometimes very harshly (see the Market Insight section). So, we are on the watch for sell signals from our indicators.
The S&P 500 chart is still positive, as Wednesday’s sharp pullback did not reach the rising 20-day moving average. There is still support in the 4,680-4,800 area, with support at 4,600 below that (see the accompanying chart). Until some of these support areas are broken, this is still a bullish chart — worthy of maintaining a “core” bullish position.
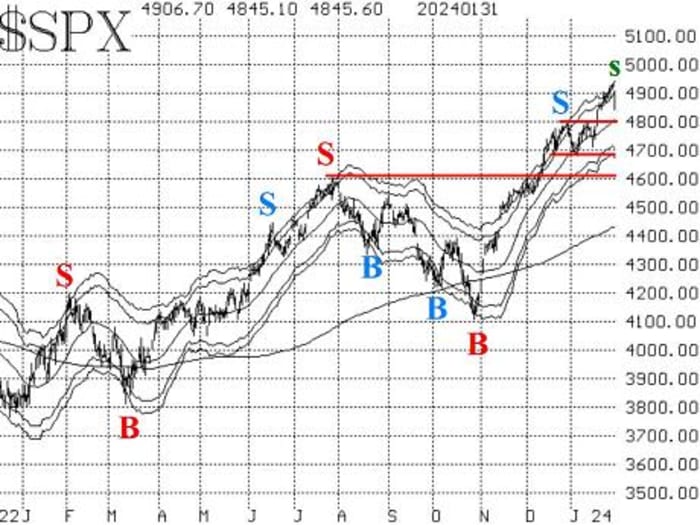
Meanwhile, SPX has fallen back below its +3σ “modified Bollinger Band” (mBB). That generated a “classic” mBB sell signal. We don’t trade those because they are subject to frequent whipsaws. However, if there is further downside confirmation, that will generate a McMillan Volatility Band (MVB) sell signal, and we do trade those. That will occur if SPX trades at 4,824 or lower.
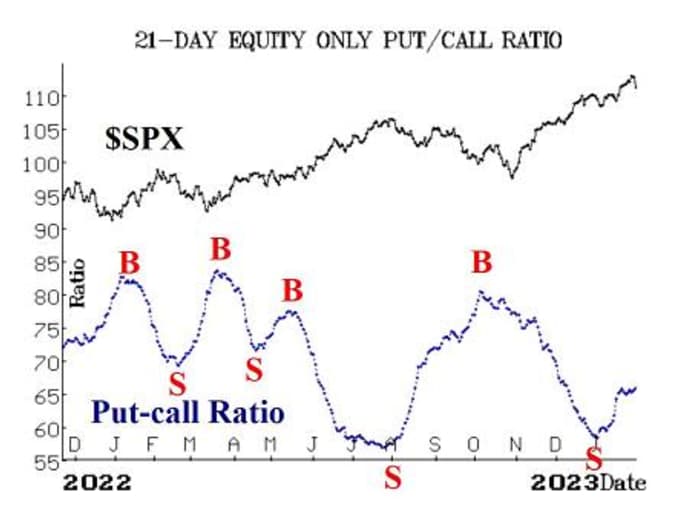
Equity-only put-call ratios remain on sell signals, at least according to the computer programs that we use to analyze these charts. The standard ratio is still moving slowly higher. However, the weighted ratio is moving more or less sideways. These would be more confident sell signals if they were steadily rising. Currently they are bearish for stocks, but not overly so.
Breadth has weakened in the past few days, and now the breadth oscillators are on sell signals. This is our shortest-term indicator and as such can be subject to whipsaws. So, we require a two-day confirmation for any new signal. If breadth is negative today, or even only modestly positive, that will be enough to confirm breadth-oscillator sell signals.
New highs on the NYSE have been strong, easily outnumbering new lows and also registering more than 100 new highs for the past six days in a row — and eight of the past nine. Yes, I realize that many of those 100 stocks are the same from day to day, but that is the way it works. So, this indicator remains on a buy signal and will continue to do until new lows outnumber new highs for two consecutive days on the NYSE.
VIX
VIX
VX00,
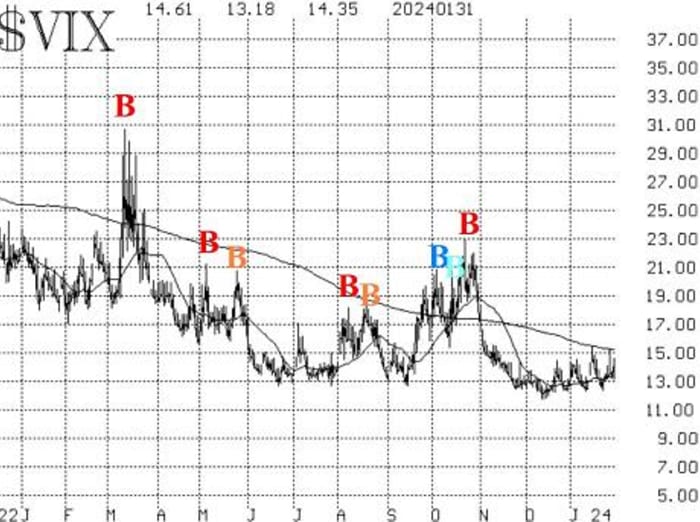
The construct of volatility derivatives also remains in a bullish mode for stocks. The term structures slope easily upward, and the VIX futures are trading with a healthy premium over VIX. The first sign of worry here would be if the front-month February VIX futures were to rise in price above the March futures, but that has not been even remotely the case.
The January seasonal pattern ends with today’s trading. The FOMC meeting definitely messed with the pattern this year. I can’t recall that happening before, but these days the market is more sensitive to FOMC statements than in past times. Now, February looms (see the Market Insight section below).
Overall, we are maintaining a “core” bullish position because of the positive nature of the SPX chart. However, we will act on sell signals if they are confirmed.
New recommendation: Potential MVB sell signal
As noted above, a “classic” modified Bollinger Band (mBB) sell signal has occurred. We don’t trade those, but we will trade a McMillan Volatility Band (MVB) sell signal if that is confirmed. Specifically, that would be confirmed if the S&P 500 were to trade at 4,824 or lower. That price is fixed, so it remains there in the following days as well as today.
IF SPX trades at 4,824 or lower, then buy 1 SPY Mar (15th) at-the-money put and sell 1 SPY Mar (15th) put with a striking price 25 points lower.
If this trade is established, it would have a target of the lower -4σ Band, and it would be stopped out if SPX were to close above the +4σ Band.
| Year | S&P 500 point move in February |
| 2002 | -23.5 |
| 2003 | -14.6 |
| 2004 | 13.8 |
| 2005 | 22.4 |
| 2006 | 0.6 |
| 2007 | -31.4 |
| 2008 | -47.9 |
| 2009 | -90.8 |
| 2010 | 30.6 |
| 2011 | 41.1 |
| 2012 | 53.2 |
| 2013 | 16.5 |
| 2014 | 76.9 |
| 2015 | 109.6 |
| 2016 | -8 |
| 2017 | 84.8 |
| 2018 | -110 |
| 2019 | 80.3 |
| 2020 | -271.3 |
| 2021 | 96.9 |
| 2022 | -141.6 |
| 2023 | -106.5 |
| Gains | 12 |
| Losses | 10 |
| Total SPX points | -218.9 |
There were gains in 12 of the years and losses in 10, but the total S&P 500 point fluctuation was a loss of 218.9, and the past six years have shown four large losses. So, a certain amount of caution is warranted from these statistics. With this background, one should be particularly careful not to avoid sell signals that may arise.
We will base this trade on a combination of factors — equity-only put-call ratio sell signal, breadth sell signal, and a rise in VIX. If the rise in VIX occurs, the others will certainly be in place.
IF $VIX closes above 15.40, then buy 1 SPY Mar (15th) at-the-money put and Sell 1 SPY Mar (15th) put with a striking price 25 points lower.
If this trade is established, we will set a stop for it next week.
Follow-up action:
All stops are mental closing stops unless otherwise noted.
We are using a “standard” rolling procedure for our SPY spreads. In any vertical bull or bear spread, if the underlying hits the short strike, then roll the entire spread. That would be roll up in the case of a call bull spread or roll down in the case of a bear put spread. Stay in the same expiration and keep the distance between the strikes the same unless otherwise instructed.
Long 4 XLP XLP Feb. (16th) 72 calls: Raise the stop to 71.70.
Long 1 SPY SPY Feb. (16th) 485 call: This position was initially a long straddle. It was rolled up, and the puts were sold. The calls were rolled up several more times, including most recently on Jan. 22, when SPY traded at 485. This is, in essence, our “core” bullish position. Roll the calls up every time they become at least eight points in-the-money.
Long 4 UNM
UNM,
Long 0 SPY Feb. (16) 469 put and short 0 SPY Feb. 16) 449 put: Bought in line with the McMillan Volatility Band sell signal. Last week, we said that the position would be stopped out if SPX closed above 4,894 on Jan. 25. It was stopped out by 10 cents. So, now we are waiting for the next potential sell signal (see the recommendation in the newsletter above).
Long 1 SPY Feb. (16) 484 call: This was originally a long straddle. The call was rolled up, and the put was sold. Roll up every time the call is eight points in-the-money. Meanwhile, set a closing stop at 480 to sell the call.
Long 3 TLT TLT May (19) 95 put: We will hold as long as the put-call ratio sell signal is in place for Treasury bonds.
Long 1 SPY Feb. (16) 486 call: This call was bought in line with the new highs vs. new lows buy signal. Stop out if NYSE new lows exceed new highs for two consecutive days. Roll up every time the call is eight points in-the-money.
Long 2 SPY Feb (9) 487 calls: Bought in line with the January bullish seasonal pattern. Roll the calls up if they become six points in-the-money. Sell all of the calls at the closing of trading on Thursday, Feb. 1. The FOMC meeting definitely interfered with this seasonal pattern this year.
All stops are mental closing stops unless otherwise noted.
Send questions to: lmcmillan@optionstrategist.com.
Lawrence G. McMillan is president of McMillan Analysis, a registered investment and commodity trading advisor. McMillan may hold positions in securities recommended in this report, both personally and in client accounts. He is an experienced trader and money manager and is the author of the best-selling book, Options as a Strategic Investment. www.optionstrategist.com
©McMillan Analysis Corporation is registered with the SEC as an investment advisor and with the CFTC as a commodity trading advisor. The information in this newsletter has been carefully compiled from sources believed to be reliable, but accuracy and completeness are not guaranteed. The officers or directors of McMillan Analysis Corporation, or accounts managed by such persons may have positions in the securities recommended in the advisory.